
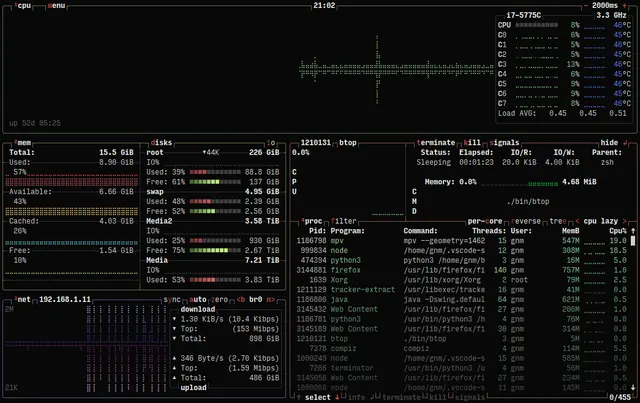

btop is an Apache-2.0 terminal resource monitor for inspecting processor, memory, disk, network and process activity. It can replace selected resource-monitoring tasks from a paid desktop utility such as iStat Menus, but it does not reproduce a macOS menu-bar layout, weather panel or notification suite. This guide follows an install-and-inspect workflow using the project's official package instructions. AltStack reviewed the upstream repository, README and license on November 2, 2026; we did not install or execute btop, and all displayed measurements are examples rather than AltStack test results.
1. Choose the task and understand the cost
Use btop when you want a live terminal view of system resources or processes on a computer you control. Its README describes processor, memory, disks, network and process statistics, along with process filtering, sorting, a tree view and selectable interface options. It is a focused monitoring screen, not a complete replacement for every feature in a graphical menu-bar monitor.
The upstream repository identifies Apache-2.0 as the application license. There is no required btop software subscription in the documented install path. The computer is yours to provide; if you inspect a rented server, its hosting charge remains separate. Optional GPU readings depend on supported hardware, drivers, permissions and how the binary was built. Redistribute the application or its artwork only with the relevant license and attribution notices intact.
2. Install through a documented package manager
Use the package manager for your operating system when it provides btop. The upstream README documents `sudo apt install btop` for Ubuntu and Debian, `sudo dnf install btop` for Fedora, `sudo zypper install btop` for openSUSE Tumbleweed, `brew install btop` for Homebrew on macOS, `pkg install btop` for FreeBSD and `pkg_add btop` for NetBSD. These are separate options; run only the command matching your system and its normal privilege rules. The package version can differ from the upstream release, so note the version reported after installation.
If your package source does not offer btop, open the official GitHub Releases page and choose the asset matching your operating system and processor. The README describes Linux release archives and package-manager routes. Check the filename and release notes before unpacking it. Do not download a similarly named binary from a search advertisement or unrelated mirror. This guide does not ask you to build the project from source or run a remote install script.
3. Start btop and confirm the terminal is usable
After the package manager reports a successful installation, launch `btop` from a terminal. The interface should show the monitoring panels supported by that operating system and build. Start with a normal user account. btop can display information available to that account; some process details, signals, Intel GPU readings or CPU wattage features may require additional permissions described by the upstream documentation.
If the terminal says the command is not found, verify the package name, installation result and executable path before changing system permissions. Use the project's documented `btop --help` or `btop --version` options to inspect the installed command. A package manager may install a different version than the current GitHub release, so use its installed behavior as the reference for the session.
4. Read the resource panels before acting on a process
Begin by observing the processor, memory, disk and network panels while your computer performs an ordinary task. A short spike is not by itself a diagnosis: compare the value over time and note what you were doing. The process list can be sorted and filtered, and the README describes a tree view and a detail view for a selected process. Use those features to identify which process corresponds to a workload before making a change.
Treat the display as a current snapshot of the machine, not a historical performance report or benchmark. Readings depend on what the operating system exposes and on the selected refresh and display settings. Avoid sending a signal or terminating a process merely because its usage looks high; first understand whether it is saving work, updating software or serving another user.
5. Adjust the display for your terminal
The project provides a menu for changing interface options and supports truecolor, reduced-color and TTY display modes. If the charts render as blank blocks, garbled symbols or clipped text, first check that the terminal uses a UTF-8 locale and a font containing the Unicode characters used by the graphs. The README identifies braille-pattern, geometric-shape and box-drawing characters as common requirements for the full display.
For a terminal with limited color support, try the documented `--low-color` option. If a remote or minimal terminal still has layout problems, `--tty` forces the lower-color TTY mode. These options change rendering; they do not repair missing sensor data or add GPU support to a binary that was built without it. Change one setting at a time so you can tell which adjustment helped.
6. Check GPU readings and permission requirements separately
GPU monitoring is optional. The upstream README says it is supported on Linux and on macOS with Apple Silicon GPUs, and requires a build with GPU support. On Linux, NVIDIA readings need a supported driver and the `nvidia-ml` library; AMD readings use ROCm SMI; Intel GPU readings require access to the relevant system files. A distribution binary may not include every optional capability, so a missing GPU panel does not necessarily mean the main monitor is broken.
The project documents `make setcap` and `make setuid` for certain process-signal, Intel GPU and CPU-wattage cases. Those settings affect permissions: do not apply them blindly or run the entire monitor as root just to make one optional panel appear. Check the upstream compatibility notes for your hardware and distribution, then decide whether the extra access is appropriate. AltStack has not tested these permission changes.
7. Keep local readings and shared screenshots in context
The documented workflow launches a terminal program on the system being monitored; it does not require creating an account in the installation steps. The README is not a complete privacy or telemetry policy, so this guide does not promise that every package, update mechanism or optional integration is network-free. Keep process names, usernames, hostnames and command-line details private when sharing a screenshot or asking for help.
The screenshot on this page is the project's own example capture and is labelled as historical provider artwork. It is not an AltStack benchmark or a measurement from your system. If you post your own output publicly, inspect it for personal paths, server names and sensitive process arguments first. Keep any operational log or diagnostic file on an access-controlled device unless you have removed identifying information.
8. Troubleshoot the common first-launch problems
If graph characters overlap, switch to a UTF-8 terminal with a font that includes the required symbols, then try `--low-color` or `--tty`. If CPU and memory panels work but GPU readings do not, confirm that GPU support was built into your package and check the driver, library and device permissions for your GPU vendor. If process names or details are missing, compare the current user's access with the operating system's process-visibility rules before granting broader privileges.
If the installed interface differs from this description, record the btop version, operating system, terminal emulator and the exact panel that is unavailable. Compare those details with the README, release notes and issue tracker for the same project. A useful report contains a small, non-sensitive example and the error text; it should not include an unredacted process list from a work or production machine.
9. Decide whether btop covers your monitoring need
Keep btop if a compact terminal view of current resource and process activity is enough for your routine checks. It is a practical fit for users who already work in a shell and want a free, open-source monitor. It can also be run in a terminal session on a server you administer, while the server's hosting and maintenance remain separate costs.
Choose a graphical monitor if you specifically need a persistent menu-bar panel, notifications, weather, historical charts or a polished desktop dashboard. btop's Apache-2.0 license and focused feature set make it inspectable and adaptable, but neither means feature parity with a paid suite. Compare the functions you actually use, the platform support and the access controls before replacing an existing monitoring workflow.
Official instructions and sources
Official btop repository, feature list and installation instructionsOfficial btop releasesApache-2.0 project licenseOfficial README: terminal prerequisites and GPU compatibilityOriginal AltStack guide by Sushil Kumar Sah. Installation steps follow provider documentation; they do not imply testing on every supported device.